Candidate
Perruzza, Anthony
Perruzza, Anthony raised $577,238 from 565 contributors across 6 Toronto municipal campaigns, 2006–2023.
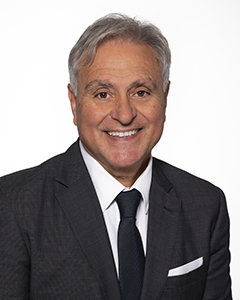
Photo: City of Toronto, 2022-2026 council term.
Raised by campaign
Each bar is one campaign for one office. Totals are what was filed with the City Clerk, before any contribution returned.
Results
Official results from the City's poll-by-poll releases. Money raised per vote received divides contributions by votes — it is not what the campaign spent, because the archive holds contributions and not expenses.
| Campaign | Office | Votes | Raised | Per vote | Outcome |
|---|---|---|---|---|---|
| 2023 By-Election for Mayor | Mayor | 3,025 | $292,575.00 | $96.72 | Defeated3,025 votes$96.72/vote |
| 2022 Municipal Election | Councillor W7 | 8,707 | $86,795.65 | $9.97 | Elected8,707 votes$9.97/vote |
| 2018 Municipal Election (25 Wards) | Councillor W7 | 8,336 | $93,932.50 | $11.27 | Elected8,336 votes$11.27/vote |
| 2014 Municipal Election | Councillor W8 | 8,705 | $40,925.00 | $4.70 | Elected8,705 votes$4.70/vote |
| 2010 Municipal Election | Councillor W8 | 4,724 | $37,585.00 | $7.96 | Elected4,724 votes$7.96/vote |
| 2006 Municipal Election | Councillor W8 | 4,738 | $25,425.00 | $5.37 | Elected4,738 votes$5.37/vote |
Contributor types
Individual, corporate and union money across every campaign.
When corporate and union money was allowed
Corporate and union contributions were legal in the 2006 Toronto election and flowed to every office. They were barred from city council and mayoral campaigns from the 2010 election onward.
That ban did not cover school board trustee campaigns, which ran under provincial rules and kept accepting corporate and union money legally through 2014 — 148 such contributions to Toronto District School Board trustees in 2010 and 166 in 2014. A province-wide ban closed that gap for the 2018 election.
Third party advertisers, a category that first existed in 2018, were not covered by either ban and could still accept corporate and union contributions.
A small residue of corporate contributions to council campaigns survives after the ban — 23 in 2010 and 12 in 2014 — which the City publishes as filed and does not verify.
This candidate ran for council or mayor only, so any corporate or union money here should fall in 2006.
Largest contributors
Across every campaign. A contributor is identified by their full name and postal code together; 15 of these gave in more than one election. Individuals are shown by postal area only; organizations in full.
| Contributor | Postal area | Total | Gifts | Campaigns |
|---|---|---|---|---|
| Perruzza, Loreto | L4L | $6,200.00 | 5 | 5 |
| Perruzza, Anthony | M9L | $6,145.65 | 5 | 3 |
| Lam, Dung | M5M | $5,650.00 | 4 | 4 |
| Racco, Paul | L7B | $5,650.00 | 4 | 4 |
| Pliamm, Lew | M5P | $4,900.00 | 3 | 3 |
| Nicolini, Raymond | L4H | $4,675.00 | 3 | 3 |
| Darvish, Fereydoon | M2L | $4,250.00 | 3 | 3 |
| Pedro, Helen | L4A | $4,000.00 | 3 | 3 |
| Bierbrier, Nathan | M5N | $3,700.00 | 2 | 2 |
| Green, Cary | M3H | $3,700.00 | 2 | 2 |
| Hertzman, Benjamin | M3J | $3,700.00 | 2 | 2 |
| Hertzman, David | M3J | $3,700.00 | 2 | 2 |
Where the money came from
By forward sortation area — the first three characters of the postal code, which is the finest geography the City publishes for individual donors. Shading is by quantile, so each band holds a fifth of the areas with money: contribution totals are skewed enough that equal dollar intervals would put almost every area in the lightest band.
Toronto and beyond
39% of this money came from outside Toronto, which the map above does not cover.
Ranked areas
When the money came in
Monthly totals for one campaign. Contribution dates exist only from 2018 onward; the 2006–2014 Open Data releases never published them, so earlier campaigns cannot be charted this way.
2023 By-Election for Mayor — Mayor · 10 months of contributions
2022 Municipal Election — Councillor W7 · 6 months of contributions
2018 Municipal Election (25 Wards) — Councillor W7 · 6 months of contributions
Campaign detail
2023 By-Election for Mayor
Defeated3,025 votes$96.72/vote
- Raised
- $292,575.00
- Contributions
- 219
- Contributors
- 201
- Median gift
- $1,000
- Largest
- $2,500
2022 Municipal Election
Elected8,707 votes$9.97/vote
- Raised
- $86,795.65
- Contributions
- 96
- Contributors
- 94
- Median gift
- $1,000
- Largest
- $4,796
- From the candidate
- $5,246
2018 Municipal Election (25 Wards)
Elected8,336 votes$11.27/vote
- Raised
- $93,932.50
- Contributions
- 130
- Contributors
- 128
- Median gift
- $750
- Largest
- $1,200
- From the candidate
- $700
- Returned
- $800
2014 Municipal Election
Elected8,705 votes$4.70/vote
- Raised
- $40,925.00
- Contributions
- 98
- Contributors
- 95
- Median gift
- $350
- Largest
- $750
- From the candidate
- $200
2010 Municipal Election
Elected4,724 votes$7.96/vote
- Raised
- $37,585.00
- Contributions
- 94
- Contributors
- 91
- Median gift
- $300
- Largest
- $750
2006 Municipal Election
Elected4,738 votes$5.37/vote
- Raised
- $25,425.00
- Contributions
- 63
- Contributors
- 62
- Median gift
- $300
- Largest
- $750